Monday, March 12, 2018
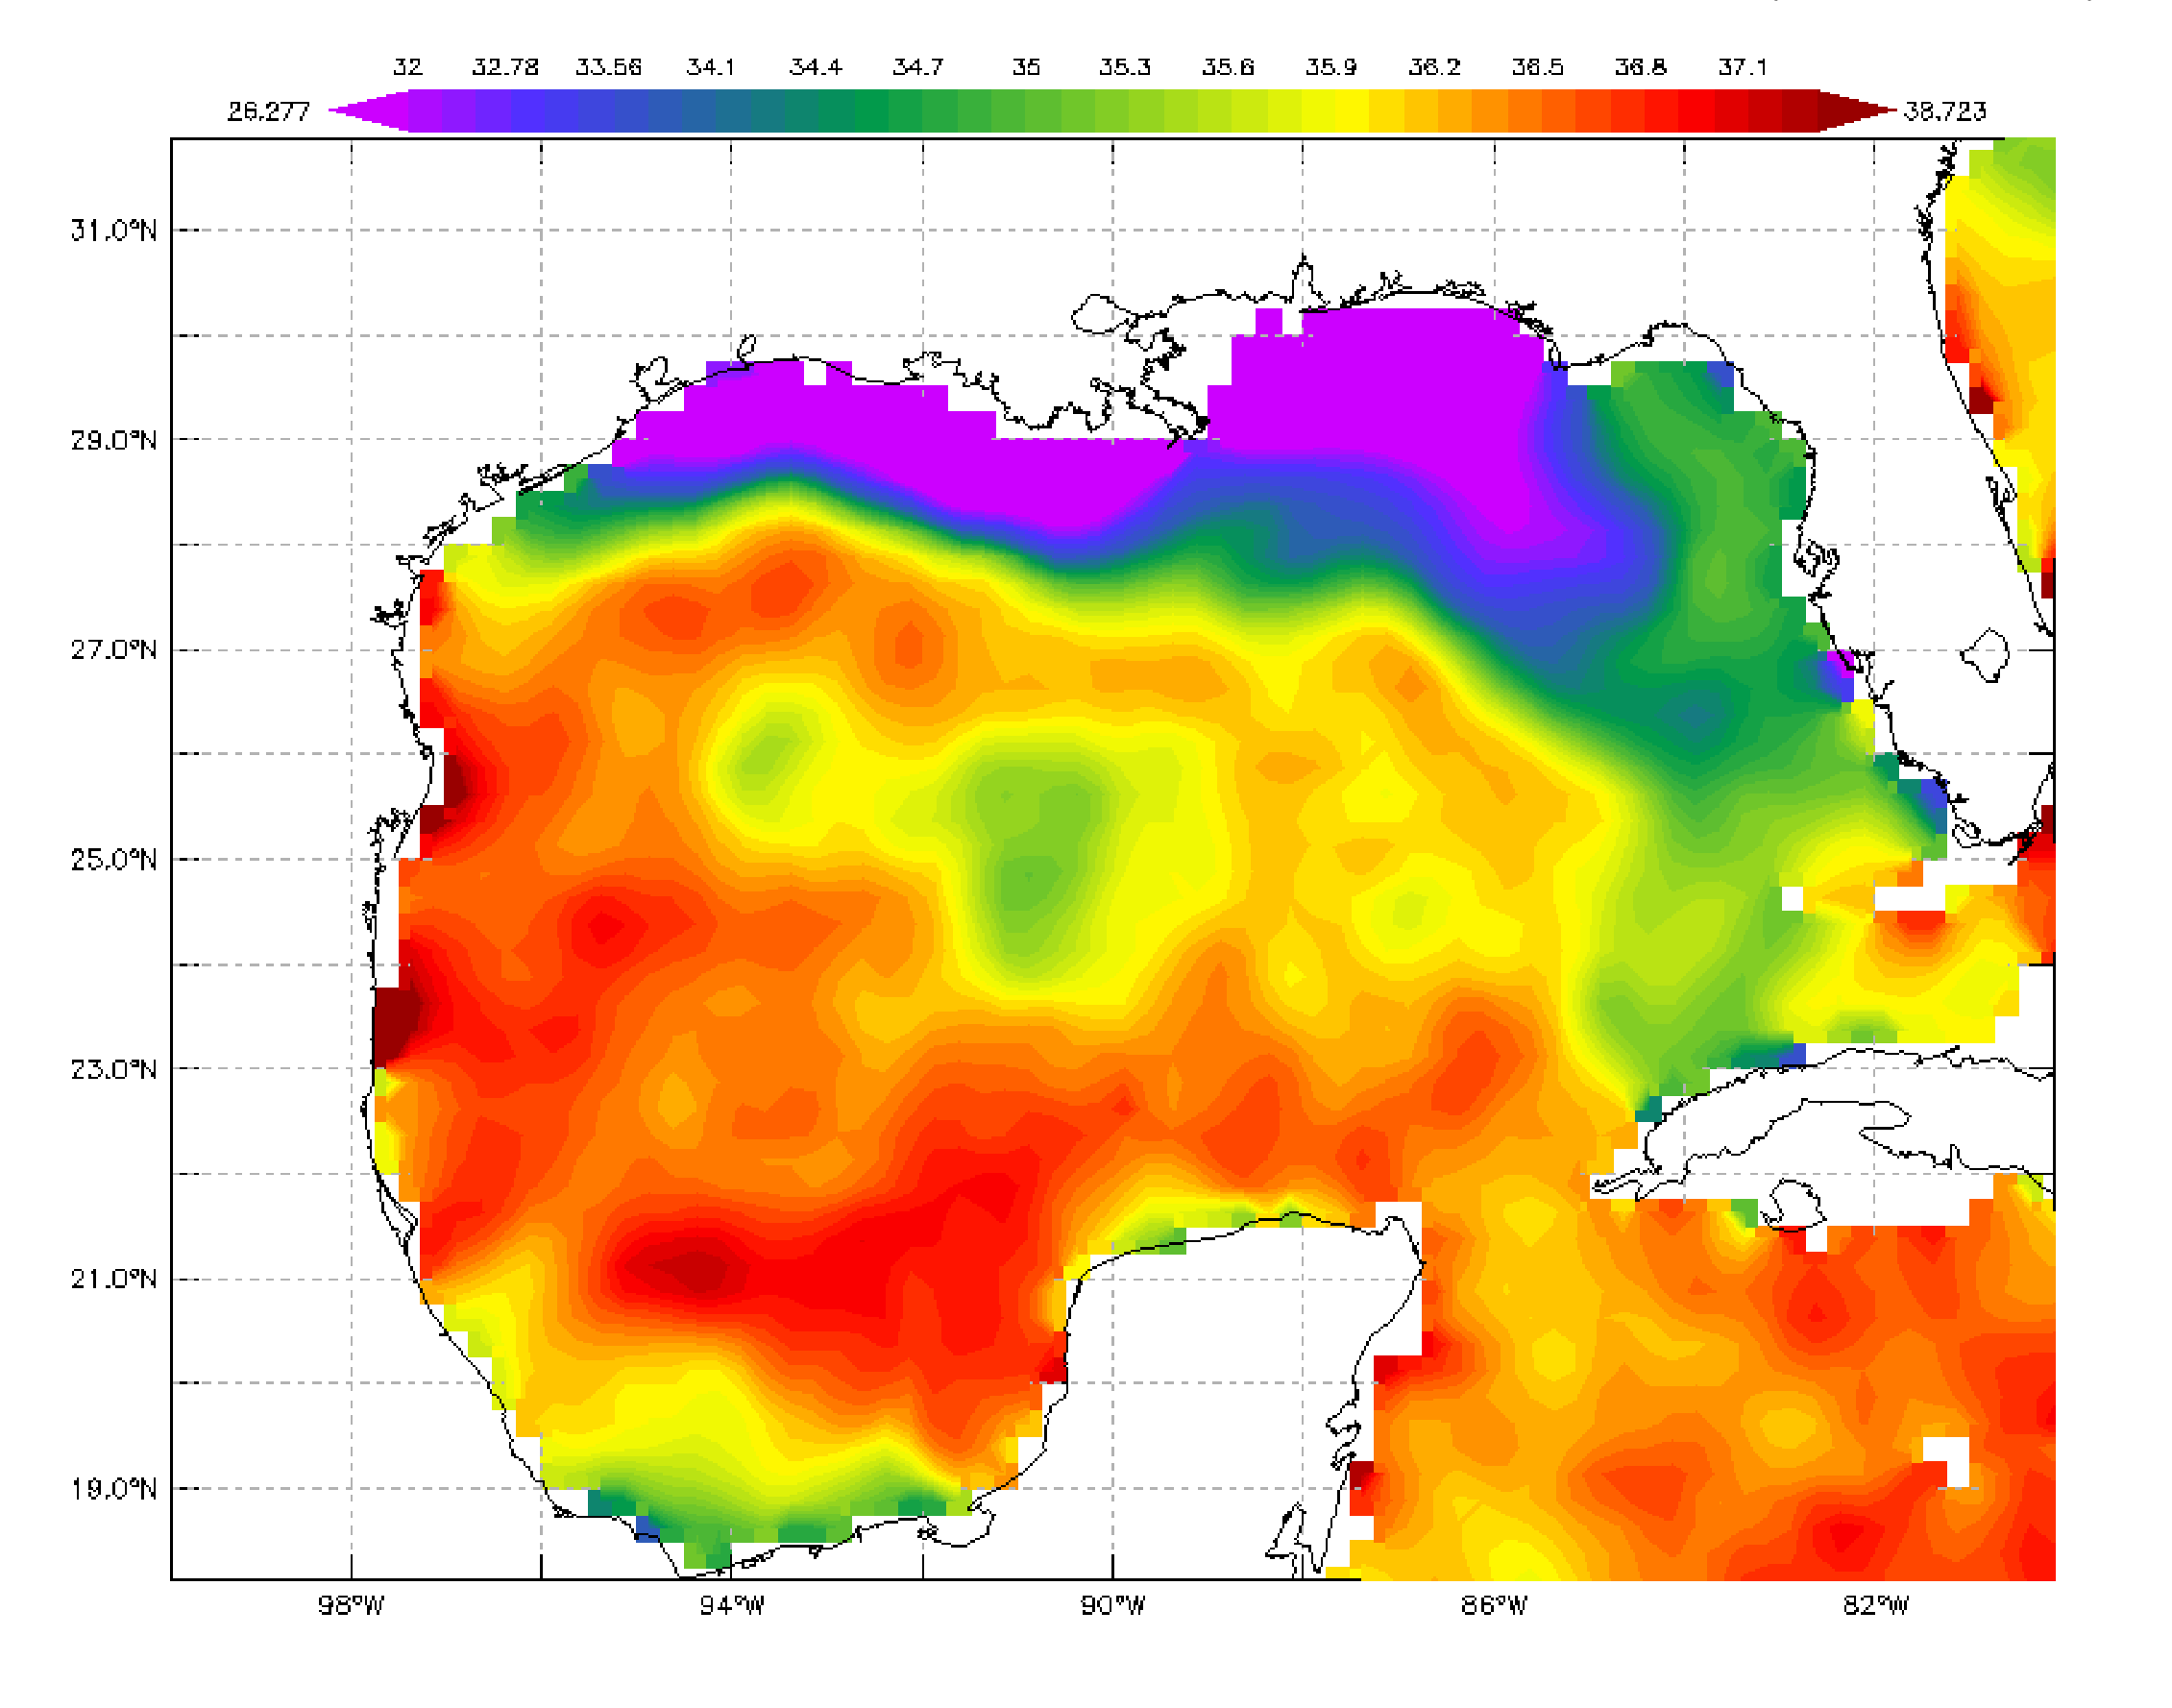
Blue/purple colors along the Texas/Louisiana/Mississippi coast (top of image) are areas of lower sea surface salinity following the passage of Hurricane Harvey. Red/orange colors to the south are areas of higher salinity. Access to the dataset can be obtained by visiting: https://podaac.jpl.nasa.gov/dataset/SMAP_RSS_L3_SSS_SMI_8DAY-RUNNINGMEAN_V2
NASA’s Soil Moisture Active Passive (SMAP) mission was designed to sense terrestrial soil moisture. By applying NASA’s salinity retrieval algorithm to SMAP’s radiometer data, it also can be used to sense sea surface salinity. SMAP salinity data are archived and distributed by NASA's PO.DAAC.
Credit: JPL/PO.DAAC