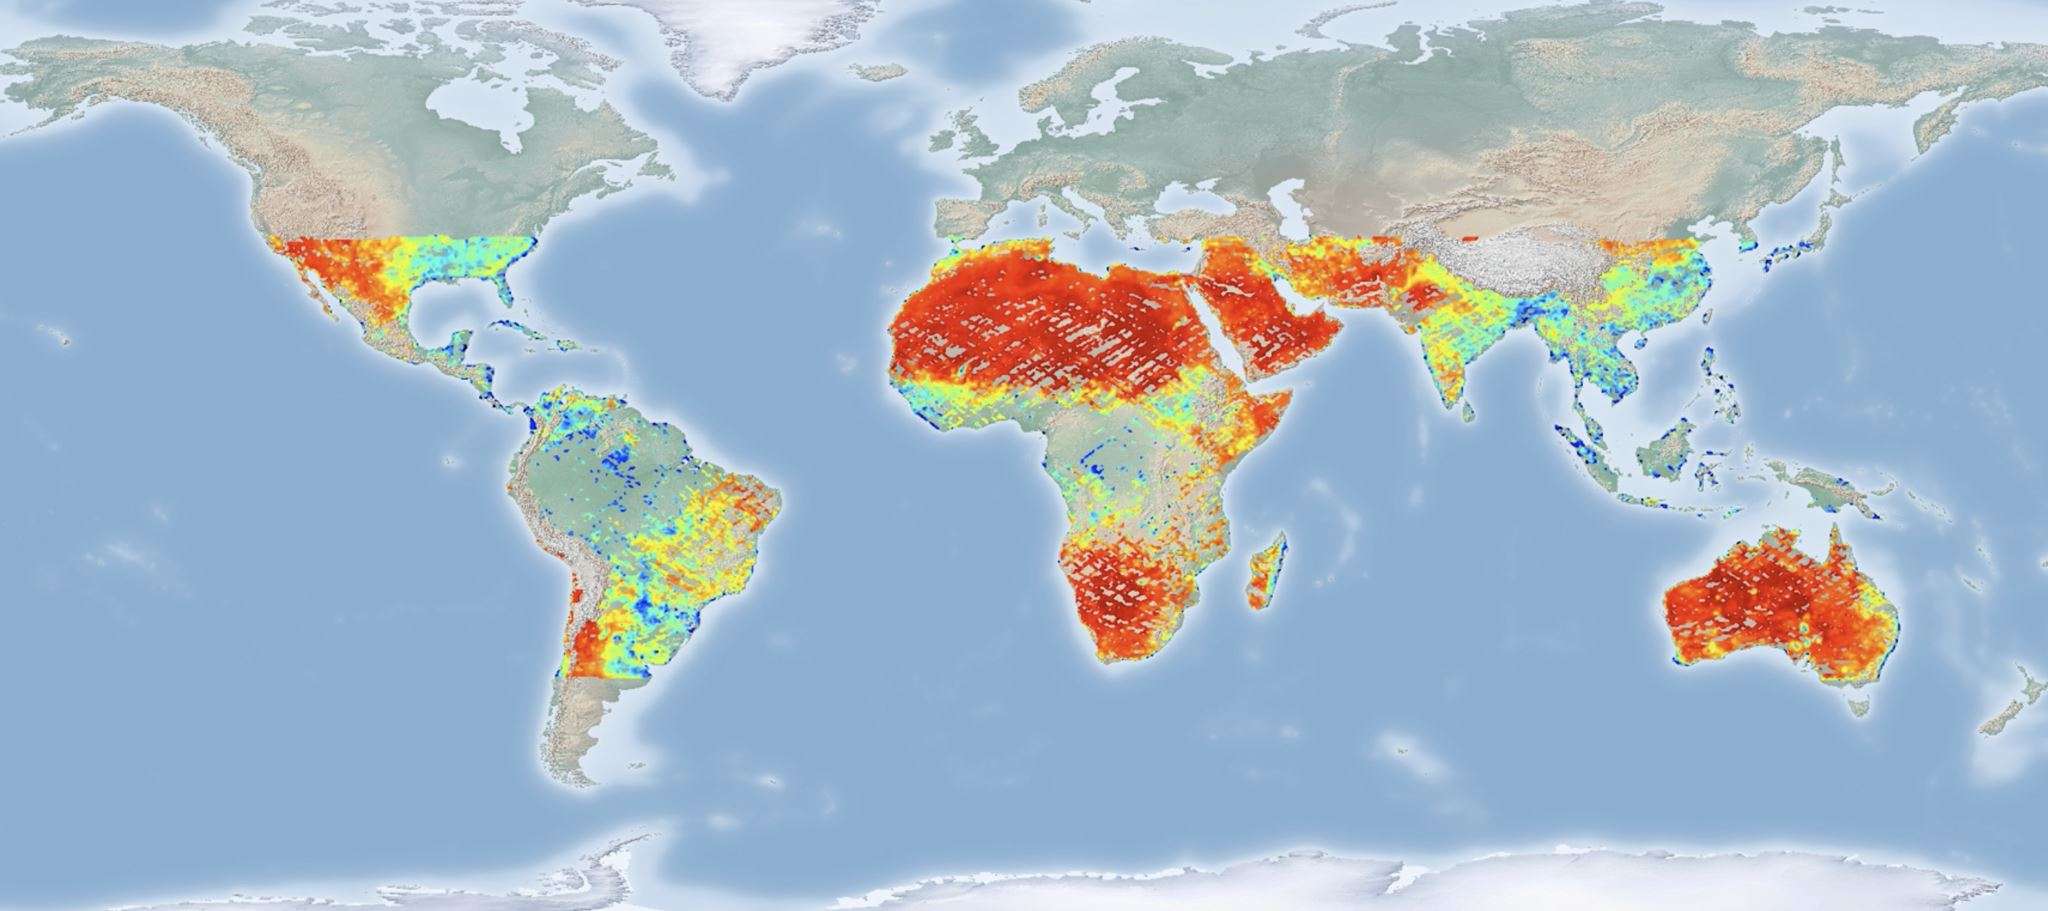
This animation depicts gridded, daily volumetric water content estimated for the 0-5 cm surface soil layer between March 2017 and August 2020.
This animation depicts gridded, daily volumetric water content estimated for the 0-5 cm surface soil layer between March 2017 and August 2020.