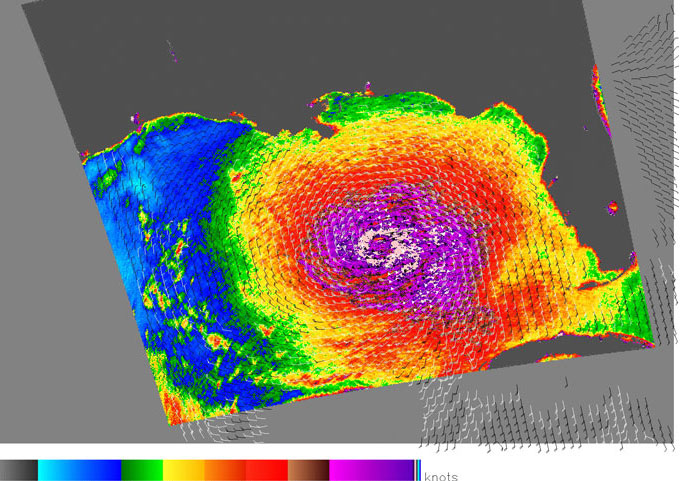
The image depicts the wind field associated with Hurricane Katrina on August 28, 2005, shortly before making landfall along the southeastern Louisiana coastline. This image was generated by using near-real-time (NRT) QuikSCAT swath data. The swath data was specially processed to generate an "ultra-high" resolution wind product, where each pixel has a 2.5 km spacing. The "ultra-high" resolution representation of wind speeds reveals more storm structure characteristics, particularly within the center of the storm, than would otherwise be seen using standard resolution QuikSCAT data. The standard resolution for QuikSCAT wind vectors is 25 km, providing for better ambiguity removal accuracy or "skill" than higher resolution products; the additional ambiguity removal results in a more accurate representation of wind speed and direction but reduces the ability to discern smaller scale features within the storm compared to the "ultra-high resolution" winds. This particular image utilizes the 2.5 km pixel-resolution for wind speeds with an overlay of 25 km resolution wind barbs (which show both wind speed and direction).
Wind barbs are oriented to show the direction of the wind while pointing downstream of the path of the wind flow. Short and long barb lines represent 5 and 10 knot wind speed increments respectively. A solid triangular-shaped barb represents a 50 knot wind speed increment. The colorbar at the bottom of the image shows the color-scaled variation of wind speed in knots. Due to the uncertainty of QuikSCAT measurements in excess of 50 knots, the color scale has been capped at this limit. The 2.5 km wind pixels are not rain-flagged, but the Level 2B-derived wind barbs are colored white to show where rain contamination could be occurring; black wind barbs are presumably where rain contamination is negligible.
It is worth noting that the 2.5 km wind product is in an experimental stage, and land contamination is likely within 17 km of the coastline. The 2.5 km wind product is distributed on request through the Scatterometter Climate Record Pathfinder (SCP) at BYU, and plotted images using this product are available via anonymous FTP: ftp://ftp.scp.byu.edu/data/qscat/HRStorms.
Feel free to contact PO.DAAC User Services for any questions pertaining to QuikSCAT products at podaac@podaac.jpl.nasa.gov.
Image Credit:
This image was generated courtesy of BYU and
JPL using near-real-time (NRT) QuikSCAT swath data.